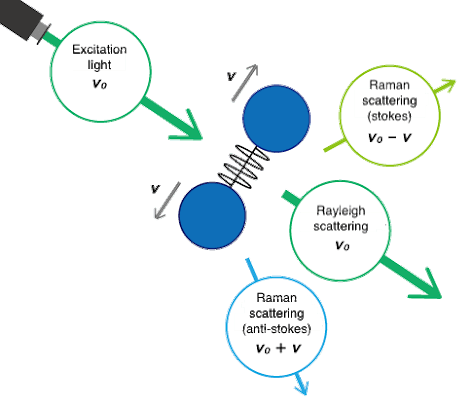
Raman spectroscopy is a popular technique for the analysis of molecular structure and is considered complementary to infrared spectroscopy. Raman spectroscopy is based on the Raman effect, which was first identified by the Indian physicist Chandrasekhara Venkata Raman in 1928. The Raman effect is based on scattering of light, which includes both elastic (Rayleigh) scattering at the same wavelength as the incident light, and inelastic (Raman) scattering at different wavelengths, due to molecular vibrations.
Raman scattering is about a million times less intense than Rayleigh scattering. Therefore, to obtain Raman spectra, it is necessary to prevent Rayleigh scattering from overpowering the weaker Raman scattering.
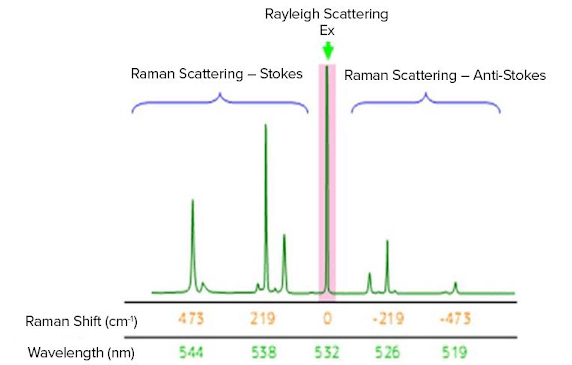
Raman spectra are measured by exciting a sample using a high-intensity laser beam, with the resulting scattered light being passed through a spectrometer. The Raman shift is the energy difference between the incident light and the scattered light. In the resulting spectrum, the vertical axis is the intensity of the scattered light and the horizontal axis is the wavenumber of the Raman shift (cm-1).
The Raman shift is associated with two different energy bands. The shift at wavelengths higher than that of the incident light is termed Stokes scattering. The shift at wavelengths lower than that of the incident light is termed anti-Stokes scattering. As an example, the Raman spectrum of sulfur measured with an excitation wavelength of 532 nm (green laser) is shown in Figure 2. Stokes scattering is observed in the lower wavenumber (longer wavelength) region and anti-Stokes scattering in the higher wavenumber (shorter wavelength) region. Typically, higher-intensity Stokes scattering peaks are used for analysis, but anti-Stokes peaks can also be used.
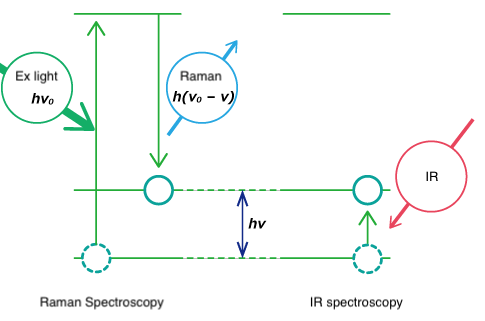
Both Raman spectroscopy and IR spectroscopy are based on molecular vibrations as illustrated below. Infrared spectroscopy is based on absorption of light energy corresponding to the vibrational energy of molecules. Raman spectroscopy is based on scattering of incident light at an energy shifted by the vibrational energy (hν) of the molecule. Vibration modes for the same functional groups are observed at the same wavenumber.
Though both are forms of vibrational spectroscopy, IR and Raman spectroscopy differ in some fundamental aspects. IR spectroscopy is based on the fact that molecular absorption at specific vibrational frequencies causes a change in the dipole moment. Raman spectroscopy relies on the change in the polarizability of a molecule at the frequencies (Raman shift) at which the molecule scatters radiation. IR spectroscopy is sensitive to hetero-nuclear functional group vibrations and polar bonds, especially OH stretching in water. Raman spectroscopy is sensitive to homo-nuclear molecular bonds such as C-C, C=C and C≡C bonds.
Raman spectroscopy offers a number of significant advantages over other spectroscopic or optical microscopy techniques. It can be used for depth profiling and microscopic area mapping of samples with a spatial resolution of around 1 μm. Optical fibers with remote probes can be used for sensitive in-situ analysis. With no combinations or overtones, there is less ‘clutter’ in Raman spectra. The technique is not sensitive to the presence of water or environmental vapor or gas. The measurement range is not limited by optical components, cells or accessories. An entire spectrum can be measured simultaneously in a wide range from 4,000 to 50 cm-1 (or even less) using a spectrometer with a CCD detector. Measurements can be performed on opaque or cloudy samples, and directly through glass or plastic containers, making sample preparation much simpler.
Raman microscopy is a non-contact, non-destructive technique that requires little to no sample preparation. Samples can be measured with a spatial resolution as small as 1 μm, and depth profiling can also be easily performed on transparent samples. Using confocal microscopy, measurement can be made in the Z direction for transparent samples, providing a three-dimensional chemical image of a sample. There are several important factors to consider when performing Raman measurements, which have a significant bearing on the quality of the data that can be obtained. Here, we will provide some insights into how to perform good Raman measurements, what may be expected from the instrument, and the key elements that affect performance.
Robert-Bosch-Strasse 14
64319 Pfungstadt
Tel. +49 61 57 / 8 08 90-0
Fax +49 61 57 / 8 08 90-99
E-Mail info@jasco.de
©JASCO Deutschland GmbH – VAT NR. | Privacy Policy | Cookie Policy | Realizzazione sito web: Alkimedia
| Cookie | Duration | Description |
|---|---|---|
| cookielawinfo-checbox-analytics | 11 months | This cookie is set by GDPR Cookie Consent plugin. The cookie is used to store the user consent for the cookies in the category "Analytics". |
| cookielawinfo-checkbox-necessary | 11 months | This cookie is set by GDPR Cookie Consent plugin. The cookies is used to store the user consent for the cookies in the category "Necessary". |
| CookieLawInfoConsent | 1 year | Records the default button state of the corresponding category & the status of CCPA. It works only in coordination with the primary cookie. |
| elementor | never | This cookie is used by the website's WordPress theme. It allows the website owner to implement or change the website's content in real-time. |
| viewed_cookie_policy | 11 months | The cookie is set by the GDPR Cookie Consent plugin and is used to store whether or not user has consented to the use of cookies. It does not store any personal data. |
| Cookie | Duration | Description |
|---|---|---|
| CONSENT | 2 years | YouTube sets this cookie via embedded YouTube videos and registers anonymous statistical data. |
| Google Maps | Google Maps is a map visualization service managed by Google Inc. and is used to integrate such contents within its pages. |
| Cookie | Duration | Description |
|---|---|---|
| VISITOR_INFO1_LIVE | 5 months 27 days | YouTube sets this cookie to measure bandwidth, determining whether the user gets the new or old player interface. |
| YSC | session | Youtube sets this cookie to track the views of embedded videos on Youtube pages. |
| yt-remote-connected-devices | never | YouTube sets this cookie to store the user's video preferences using embedded YouTube videos. |
| yt-remote-device-id | never | YouTube sets this cookie to store the user's video preferences using embedded YouTube videos. |