Circular dichroism (CD) is a phenomenon in which the degree of absorption of left and right circularly polarized light is different in the absorption wavelength range of optically active substances. CD measurements detect these differences by passing left and right circularly polarized light through an optically active sample. The transmitted light is then elliptically polarized, and this phenomenon is called circular dichroism (CD) and is expressed by the ellipticity θ (Figure 1). A plot of the wavelength dependence of this ellipticity is called a circular dichroism spectrum (CD spectrum).
Many medicines and foods contain optical active (chiral) compounds. Figure 2 shows the L- and D-forms of glyceraldehyde, which normally exists in the D-form in nature. Chiral medicines and foods exhibit different properties and effects with enantiomers that are mirror images, because the organism in which they work also has chiral properties.
For example, the L-form of menthol is used as a refreshing agent in chewing gum and toothpaste, but the D-form is not effective for this purpose. Similarly, Dopa, a treatment for Parkinson’s disease, is effective in its L-form only. Thus, it is necessary to know which substance is used and how pure it is, because the L- and D-forms act differently. If a chiral molecule has an absorption band, CD measurements can be performed, but ORD and optical rotation measurements are applicable even if there is no absorption band.

The following methods are available for distinguishing chiral molecules and optical isomers (L and D).
CD/ORD is a spectroscopic measurement method, and offers the advantage that the sample can be measured in a solution state without any special pretreatment.

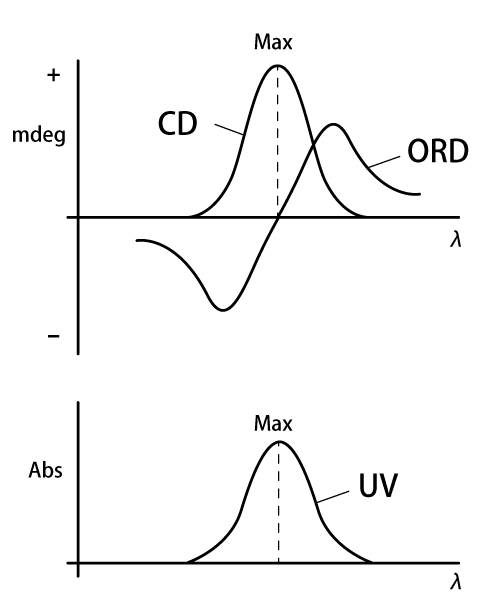
Figure 3 schematically shows the relationship between the CD/ORD spectra and the UV spectrum in the absorption wavelength region. Within the UV spectral range, anomalous dispersion of the ORD spectrum and a peak in the CD are observed. These two phenomena are called the Cotton effect, and provide clues to the configuration and conformation of optically active substances. Three items of information can be obtained from the Cotton effect:
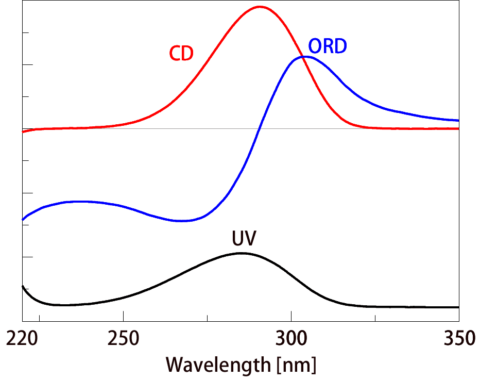
Figure 4 shows the UV, ORD and CD spectra of (1S)-(+)-10-camphorsulfonic acid ammonium salt. The Cotton effect is seen in the wavelength range of 220 to 350 nm. When the maximum ORD value is at a long wavelength as in this case, this is called a positive Cotton effect. When the maximum is at a short wavelength, it is called a negative Cotton effect. The (1R)-(-)-10-camphorsulfonic acid ammonium salt, which is an optical isomer of (1S)-(+)-10-camphorsulfonic acid ammonium salt, has an ORD maximum at a short wavelength. By measuring the ORD and CD spectra, it can be determined whether the D- or L-form is present.

Robert-Bosch-Strasse 14
64319 Pfungstadt
Tel. +49 61 57 / 8 08 90-0
Fax +49 61 57 / 8 08 90-99
E-Mail info@jasco.de
©JASCO Deutschland GmbH – VAT NR. | Privacy Policy | Cookie Policy | Realizzazione sito web: Alkimedia
| Cookie | Duration | Description |
|---|---|---|
| cookielawinfo-checbox-analytics | 11 months | This cookie is set by GDPR Cookie Consent plugin. The cookie is used to store the user consent for the cookies in the category "Analytics". |
| cookielawinfo-checkbox-necessary | 11 months | This cookie is set by GDPR Cookie Consent plugin. The cookies is used to store the user consent for the cookies in the category "Necessary". |
| CookieLawInfoConsent | 1 year | Records the default button state of the corresponding category & the status of CCPA. It works only in coordination with the primary cookie. |
| elementor | never | This cookie is used by the website's WordPress theme. It allows the website owner to implement or change the website's content in real-time. |
| viewed_cookie_policy | 11 months | The cookie is set by the GDPR Cookie Consent plugin and is used to store whether or not user has consented to the use of cookies. It does not store any personal data. |
| Cookie | Duration | Description |
|---|---|---|
| CONSENT | 2 years | YouTube sets this cookie via embedded YouTube videos and registers anonymous statistical data. |
| Google Maps | Google Maps is a map visualization service managed by Google Inc. and is used to integrate such contents within its pages. |
| Cookie | Duration | Description |
|---|---|---|
| VISITOR_INFO1_LIVE | 5 months 27 days | YouTube sets this cookie to measure bandwidth, determining whether the user gets the new or old player interface. |
| YSC | session | Youtube sets this cookie to track the views of embedded videos on Youtube pages. |
| yt-remote-connected-devices | never | YouTube sets this cookie to store the user's video preferences using embedded YouTube videos. |
| yt-remote-device-id | never | YouTube sets this cookie to store the user's video preferences using embedded YouTube videos. |